S U N S E T S
HEY! VSAUCE HaSFi! Valent here...
Ever sat at an open field or beach, to watch the sun set?
If no, you should probably do it someday, well I love watching the sunset, not only because I like seeing the stars and satellite constellations fade in, but also, because the sky changes its color as well the sun does...
Sky color...
Rayleigh Scattering is responsible for making our skies and blue eyes BLUE, shorter wavelengths like violet and blue gets scattered more in the particles that make blue eyes and air than longer wavelengths like yellow and red.
Except when during the sunset, there is way more air in the way, so all the blue light coming from the sun scatters in the way, and only the yellows and red photons manage to go practically straight through towards your retina... We see a orange/reddish sun setting...
You can also observe this phenomenon while in pretty polluted urban areas, when the pollution makes the air so dense, that you can actually the see the golden disk of the sun through the smog.
The atmosphere thickness is roughly 100km, being that most of it (97~99%) is concentrated in less than 30km high, during noon you can see the blue sky and an overall white/yellowish sun.
When the sun is setting, there is around 639km of atmosphere in the way, making it reddish, and for that, since yellow/red light are ~45% the visible spectrum, we can assume this much atmosphere is gradually responsible for "absorbing" ~65% of the incoming sunlight, we will come back to this later.
If we make the atmosphere thicker, twice as thick for instance, during noon the sun will appear yellow as during 9h and 15h because of those extra ~30km in the way. As such, during sunset or sunrise, there will be ~816,5km, in this case absorbing up to 83% of the visible spectrum, letting only red and deep red pass by.
Now remember when I said that the atmosphere "absorbs" blue light in the path during sunset?
We can plot how much air is needed for the sun to appear a certain color, this will give us some idea of what is going on.
Okay, so, for an Earth-sized planet and an Earthly atmosphere, we have:
Atmosphere height = 32km (99% atmospheric mass)
50% of AT.mass is located within 5,5km from ground.
40% of AT.mass is located between 5,5km and 18km from ground.
9% is located between 18km and 32km from ground.
1% is spread up 600km high (ignore it)
Then we notice that:
50% AT.mass occupies only 17% of the AT.volume.
40% AT.mass occupies another 54% of the AT.volume.
10% AT.mass is spread across the rest 28% of AT.volume.
And this proportions are valid for any direction you look at in an earth-like atmosphere.
Let's face the atmosphere density as those 3 phases, any direction we look at will pass through these 3 phases, but in different scales, unless you are in higher altitudes, but we are counting for an observer at sea level.
Now, for Earth we have 639,28km of air in the way during sunset, which is ~19,97x thicker than the atmosphere at zenith.
Using triangles and the horizon drop to determine at what distance each phase of atmosphere ends, we see that the phases maintain their proportion, like we said before.
50% of the air in the way stands up only in the first 110km, the other 40% are up to 458km and etc.
110km is 20x thicker than 5,5km, hence, we have 20x more absorbency than at noon, we find that at noon, atmosphere filters 3,25% the visible spectrum starting from violet.
If the sun is 45º high, the atmosphere in its direction is 14,14x thicker so its absorbency is 14x than at n--
NOOOO NONONO! Am gonna stop you right there!
See, when we draw our triangle being 32km high (atmosphere height) and 45º in one side, we get our hypotenuse 452,5km long, the path of light is 14x greater than at zenith, BUT when we look at our phase boundaries, they've only grown up by 40%, then the real absorbency is 1,4x the zenith's.
At sunset/sunrise and noon are the only valid straight up values that are true, for any other direction you must divide the hypotenuse length by the atmosphere height which happens to be the opposite side of the triangle.
Now, how do I calculate this for a different planet?
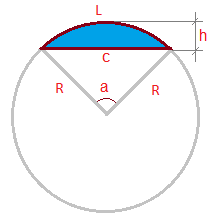
We will need to calculate chords...
On the picture:
L - arc length
h- height
c- chord
R- radius
a- angle in degrees
But, let's consider 3 things first:
1. We know the radius of our planet (Rp), and we know the height of our atmosphere at the zenith (hA).
2. We know the radius of our atmosphere. (RA= Rp + hA)
3. Height of our chord shouldn't be higher than hA.
Now, let's say our planet is 5.000km radii, and it's atmosphere is 52km high (sun-like star):
Rp = 5.000 km
hA = 52 km
RA = 5.052 km
c = 2 * [ RA * sin( a / 2 ) ]
c = 2 * [ 5.052 * sin( 16,458 / 2 ) ] = 1.446.18 km
Since we can only look one direction at the time (duh) we just need half this segment for our maths... So our useful c' is 723km.
h = RA * [ 1 - cos( 16,456 / 2 )]
h = 5.052 * [ 1 - cos( 16,456 / 2 )]
h = 52,00 km.
For Earth the angle a just happens to be 11,463º.
Okay, so 723km are 13,9x thicker than 52km, and 52km is 1,625x thicker than 32km.
1,625 * 3,25% = 5,28%, is how much light is scattered away during this planet's noon.
13,9 * 5,28% = 73,392%, is how much light is scattered away during this planet's sunset/sunrise.
I will someday find out a real formula for that which will pop the exact ratio of atmosphere in the way, but for now, we have a Desmos graph, and even so, my abilities with it are pretty limited...
This graph is configured for Earth, and I recommend you to have a protractor in hand while calculating your angles...
Here is how it works:
Line Code:
Green - Earth's surface
Blue - 5,5km high (Lower Troposphere)
Purple - 18km high (Lower Stratosphere)
Black - 32km high (Stratosphere)
Red - Viewing path
Variables:
c - Any value between 0 and -10 will give an angle between 0º and 90º up. Tweak in between 0 and -1 for angles up to 45º. Check your angle by aligning the protractor with the graph's origin.
r - Planet radius.
b - height of the graph, set it to minus r so your planet surface lies on the origin.
To obtain the atmospheric layers radius, divide it's height* by the planet radii, then subtract it from 1,0. Set the numeric variable in the graphs with the resulting number.
*calculate the heights with the proportions previously stated.
Since your observing point is the origin (0,0), the intersection point between the red line and any atmospheric layer coordinates gives your triangle sides, where the X coord. is the base, and the Y coord. is the opposite side. Square them up and root the hypotenuse up to get the path.
If your line pass through the (14.4 , 2.4) coordinates (Lower Troposphere), your triangle is 2,4²+14,4² = 14,59². 14,59km is 2,65x 5,5km, then, by looking 9,46º the atmosphere visible light absorbency is 2,65x that of noon.
You can follow like that and so on.
Bye.
- M. O. Valent, 25/06/2019